Juliana Kasmanas
Explore the map

Snapshot of the Milky Way

Snapshot of the Milky Way is an interactive 3D map that layers seven astronomical datasets to reconstruct the shape of our galaxy.

  • Product designer
  • Palantir design challenge
  • 2026
  • Web
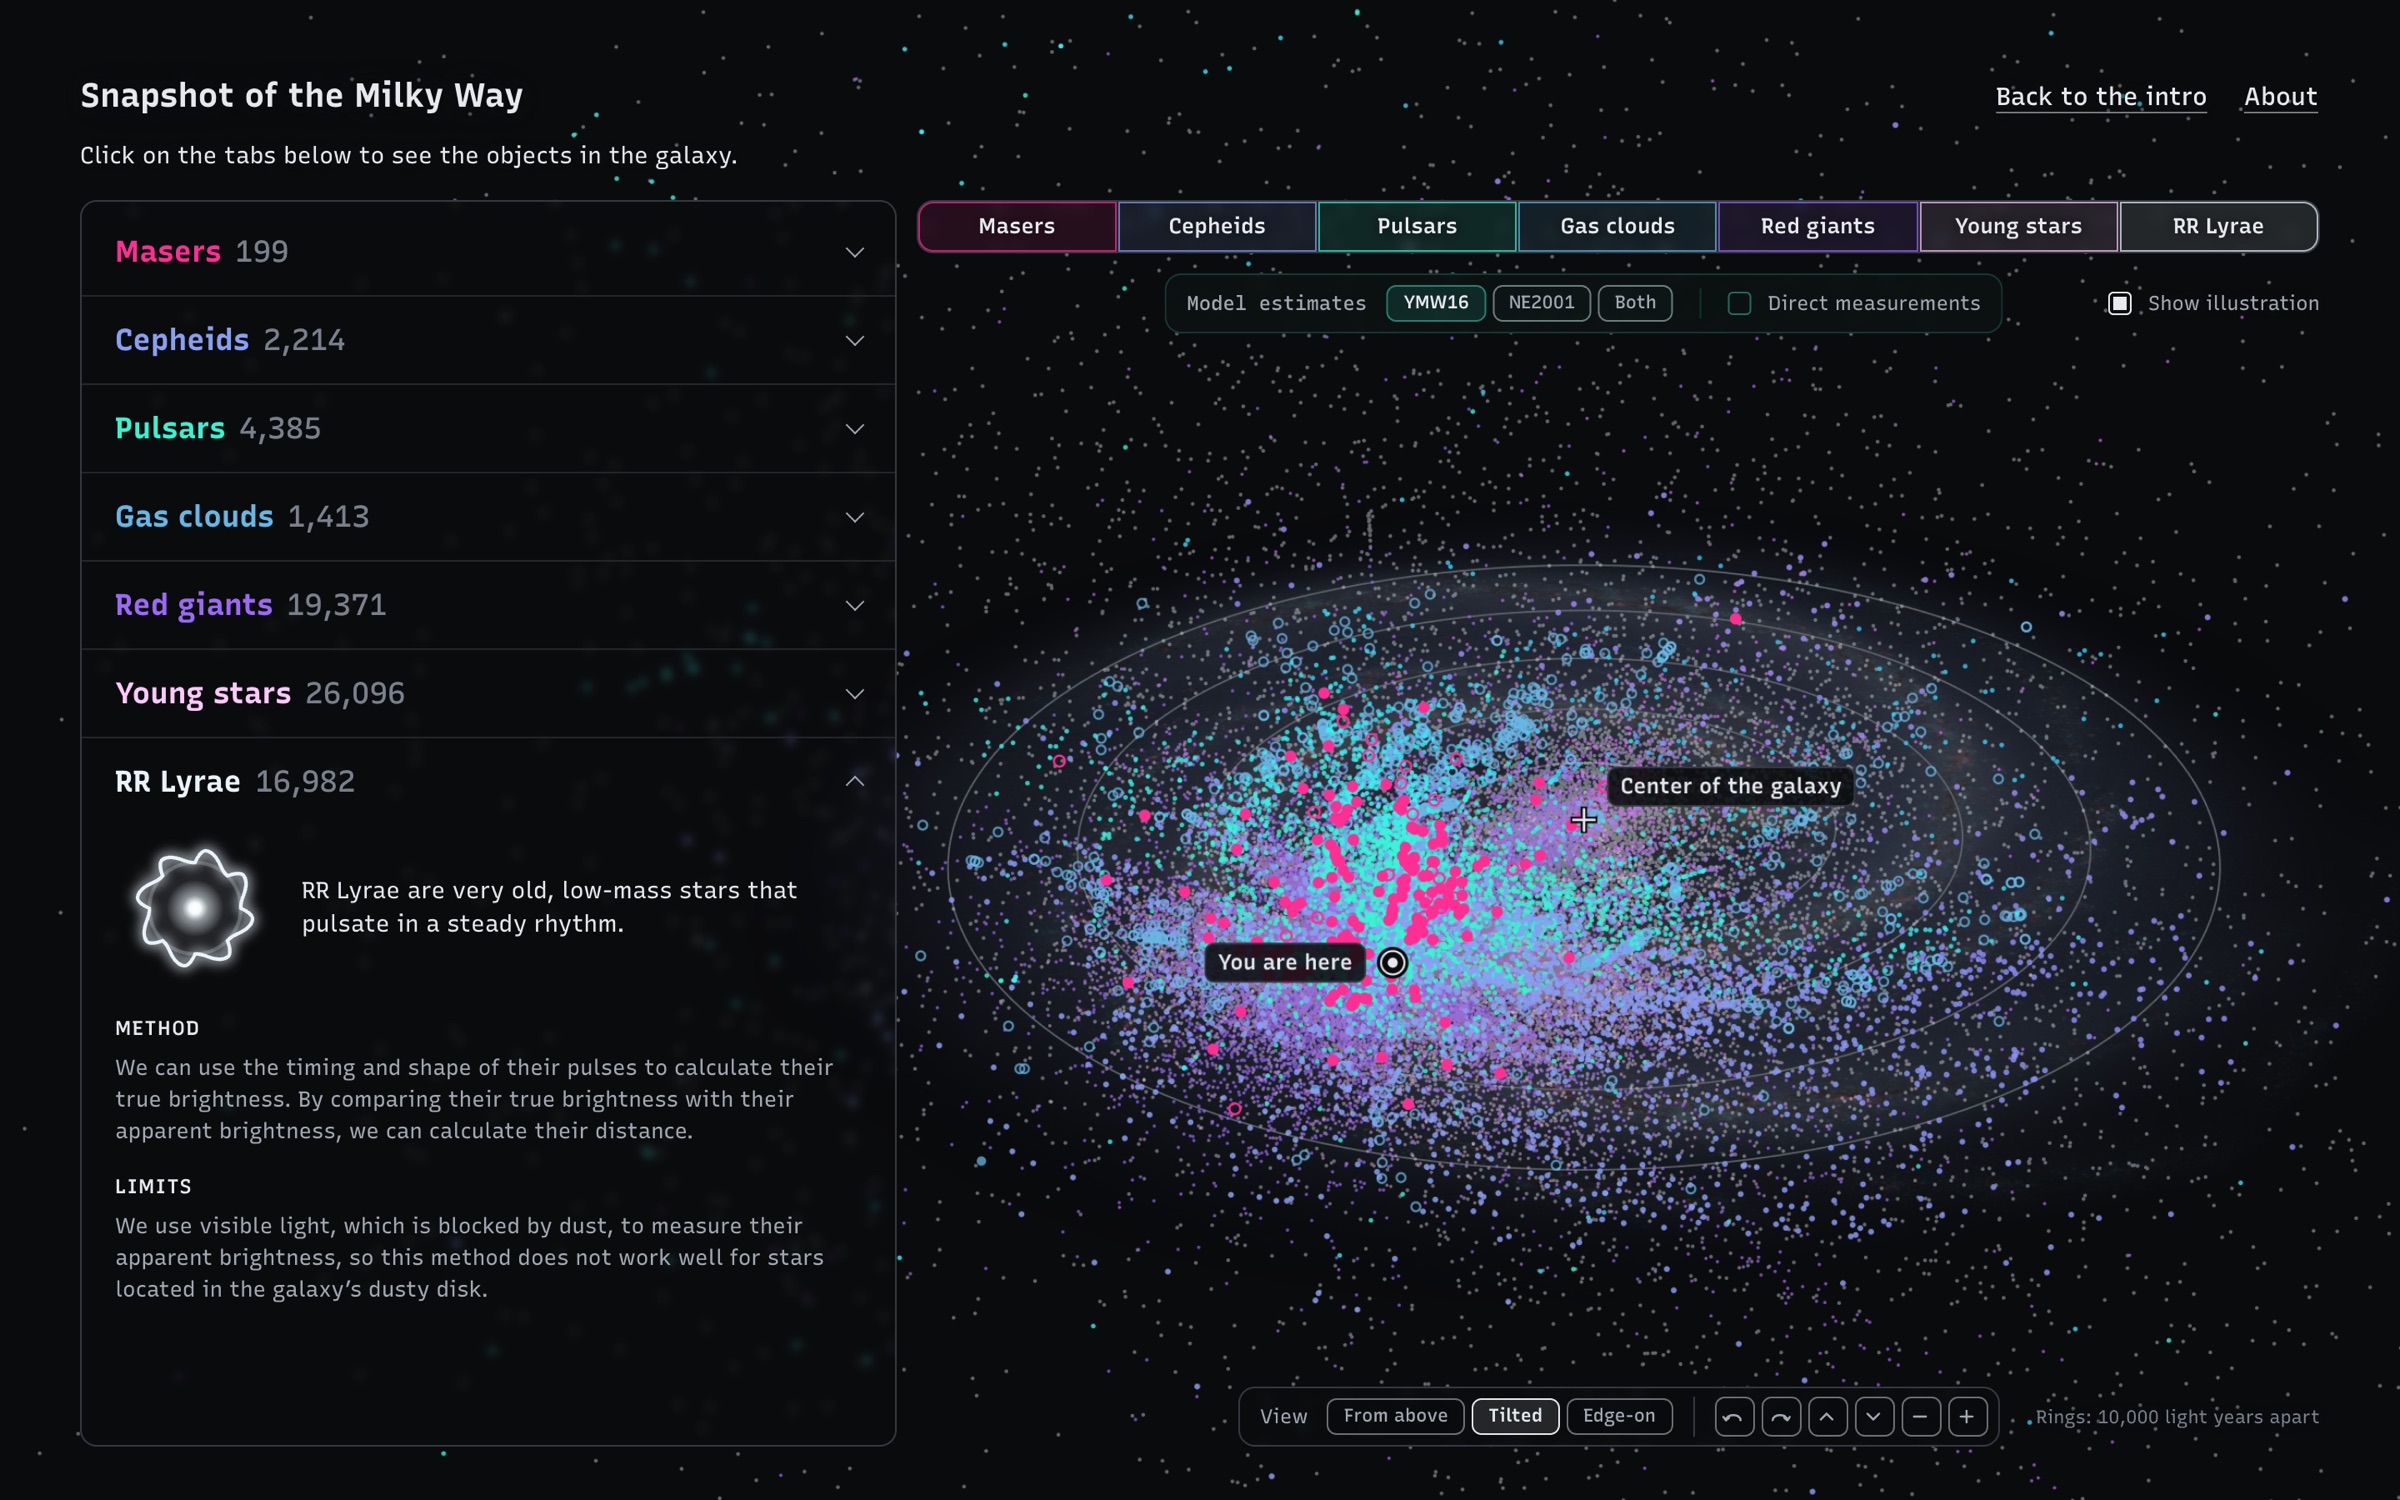
The app on a computer: the galaxy seen tilted, filled with dots in seven colours, one per measurement type, with You are here and Center of the galaxy marked. The list of measurements is on the left, with RR Lyrae open to its method and limits.
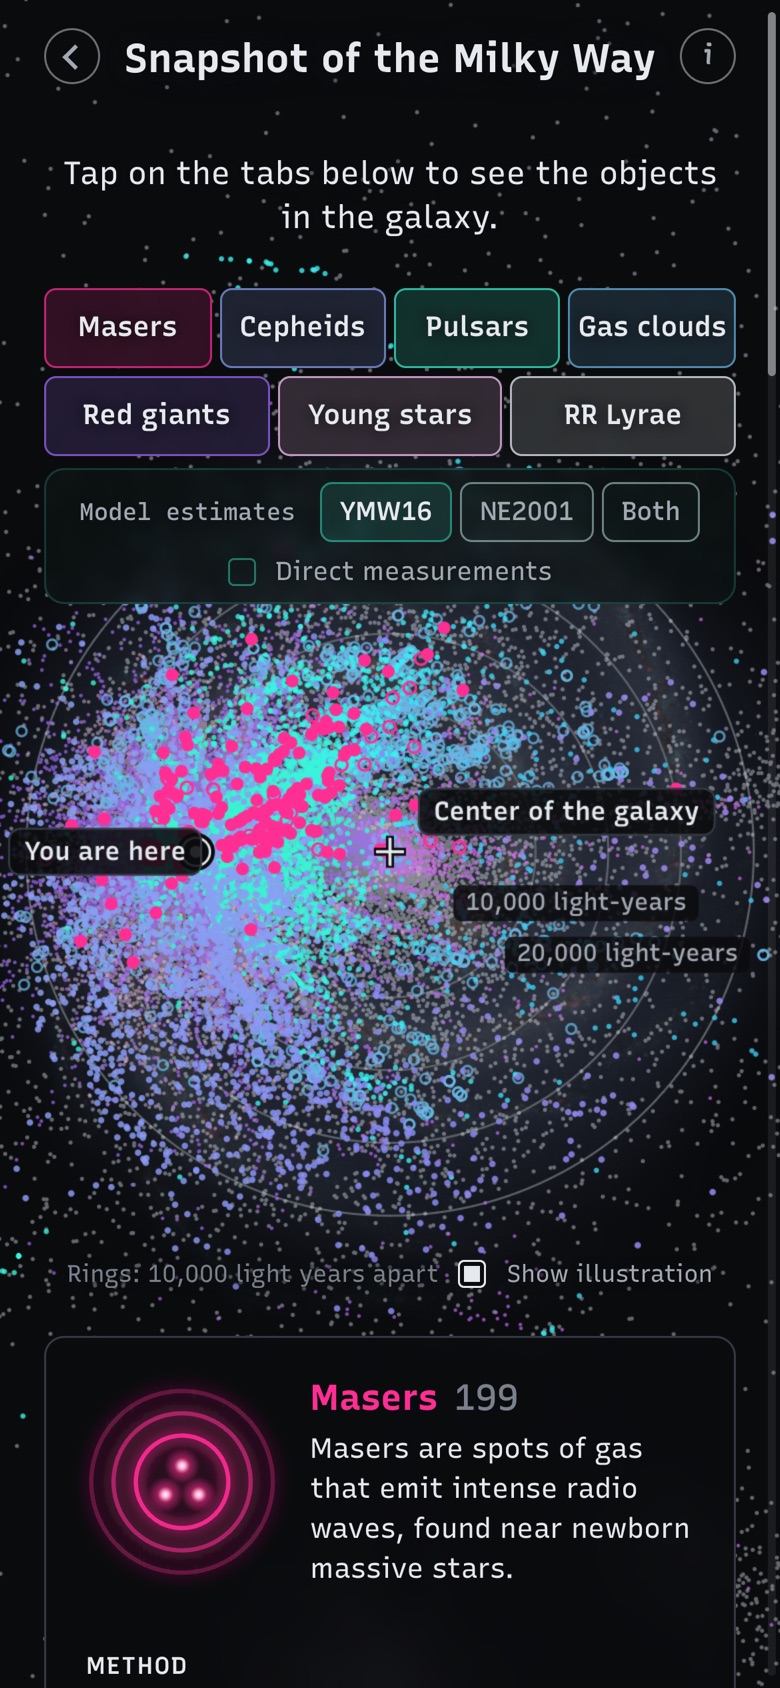
The app on a phone: the seven measurement tabs above the tilted map, and the Masers card below it.

Galaxy illustration behind the map: NASA/JPL-Caltech/ESO/R. Hurt, CC BY 4.0.

Problem

Because nothing humans have built has ever left the galaxy, every image of the Milky Way from above is actually an illustration, built from data collected by scientists over nearly two centuries.

This data sits across separate academic papers, mixes direct observations with model estimates, and varies in accuracy. I selected seven different datasets and pulled them into one 3D space, allowing users to layer them and see how together they form the image of the galaxy we know. Most only reach our side of the galaxy, showing that our map of the Milky Way is actually a map of our ability to measure the universe.

Design decisions

Intro pages

The map includes a step-by-step intro explaining that images of the Milky Way are built from astronomical data collected through different methods. It takes a table of maser distances and turns each row into a dot, showing how raw table numbers translate into points in space before opening the full view.

Layered tabs with visual keys

The map is divided into seven tabs, one for each measurement. Users can activate them to add their objects onto the map, and each tab includes a drawn key with details explaining the measurement and what its objects represent.

Making uncertainty explicit

Some measurements are less certain than others. For instance, pulsar distances rely on models rather than direct observation, so I grouped them under Model estimates (splitting out the two models used) and added a toggle for comparison with Direct measurements. Masers with over 20% uncertainty were rendered as hollow dots.

Pivoting from 2D to 3D

I started with a flat map to lock in the information architecture, then prototyped a 3D version in parallel. Once I saw how clearly the layered datasets separated in 3D space, I cut the 2D view and shipped only the 3D map.
AI workflow

Verifying the science

I used Claude to find the published catalogs behind each measurement and convert them into map data. Because AI can misstate technical nuances, I cross-checked the explanations against the original papers, making sure the seven datasets and their uncertainty ranges were represented accurately.

Designing in live code

I set the concept, wrote the copy, and made the layout and scope calls while using Claude to build directly in the browser. Working with live data instead of static mocks let me see how the seven layers actually overlapped in space and adjust the cards, keys, and mobile layout after each build.

Accessibility baseline

I had Claude audit the code against WCAG 2.2 AA and fix contrast, keyboard navigation, and focus issues. Automated tools verified the fixes, though the 3D canvas still needs testing with a real screen reader.